
Sloan Sports Analytics Conference: Research Paper Finalists
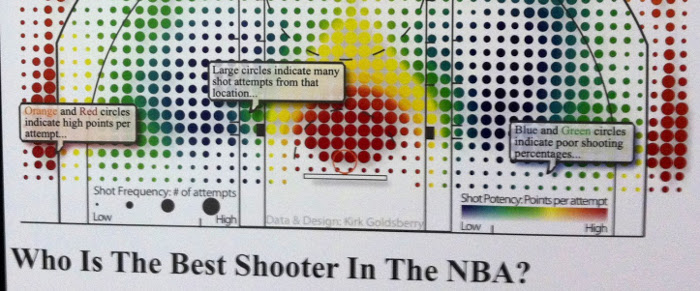
Photo of a chart from Kirk Goldsberry's research.
Chris Gorski
(Inside Science) -- The conference is now concluded, but it's likely that a lot of the research presented here will have a longer-lasting effect. On Friday, I saw the presentations of the two research paper finalists. They were both about taking a fresh look at common basketball statistics. The researchers both took advantage of the new types of motion tracking and spatial data being collected at NBA games to develop new ways to look at shooting ability and rebounding.
Here's a photo of a chart from Kirk Goldsberry's research into making a more sensible statistic to explain field goal shooting. He's a geographer at Michigan State and Harvard.
Goldsberry's paper was awarded the runner up prize in the research paper competition. On Friday, he began a presentation about the work by explaining that conventional basketball analytics are poor representations of the spatial nature of basketball.
He explored field goal percentage, which is calculated by dividing the number of shots made during a game by the number of shots taken. Because individual players shoot from different areas of the court, field goal percentage itself is not particularly useful, he indicated.
In this work, Goldsberry developed a measure he calls range percentage, which indicates a player's shooting from all parts of the scoring area. Using a database of over 700,000 shots, he was able to develop a plot of shooting success and location. The picture above indicates in reds, oranges and yellows where players are most successful (they make more than 1 point per shot) and in greens and blues where they are least successful. Points per shot is a measure of efficiency on offense.
Goldsberry said that the work applied geography techniques, something called visual analytics, in order to make charts that are easy to interpret visually.
In his presentation, Goldsberry said, "This paper is less about finding out who the best shooter is and more about figuring out new techniques to analyze data and performance."
Goldsberry also made charts for individual players, which show where they are most and least successful. The average NBA player scored 17.2% on this rating -- the most varied and successful shooters scored around 30%. Goldsberry explained a bit about how even the top shooters vary considerably -- Steve Nash and Ray Allen both perform well, but in different areas. Dirk Nowitzki succeeds in making shots from areas on the court that most people don't do well.
The technique could be used for developing other new stats or making comparisons that were previously not easily done, he said.
The winning paper was about rebounding, presented by Rajiv Maheswaran, from USC's computer science department, working with several who worked with several individuals from the department, using optical tracking data collects by a company called STATS. They also used spatial analysis to learn more about basketball.
The data includes the locations of all the players on the court as well as the ball. What this enabled Maheswaran to do was take a new look at rebounding by analyzing player movement and location as the ball descends after a missed shot.
The trouble with rebounding, Maheswaran said in his presentation, is that it's the end result of many things -- positioning, where the shooter was on the court, team strategies, and more.
From the data, the team found that most missed shots drop below 8 feet of elevation within14 feet of horizontal distance from the rim. They concluded, perhaps not surprisingly, that the most significant factor in successful rebounding by the offense is making sure an offensive player is closest to the ball.
Again, the researcher explained that the development of the technique was probably more important than the actual results. The data can be used to analyze offensive rebounding by shot location and be included in design of an offensive system, because player movement affects many variables.
Maheswaran said that in an offense the expected field goal percentage matters -- the likelihood that an offense can generate high percentage shots -- but so does expected rebounding percentage -- a strategy that improves rebounding chances also improves overall offensive output, even if they don't make the same proportion of their shots.
One conference attendee I talked mentioned that he thought the technique was the revolutionary aspect of the research and that it opened up a whole new avenue of analysis.